Earn Revenue & Support the Grid with Demand Response in PJM
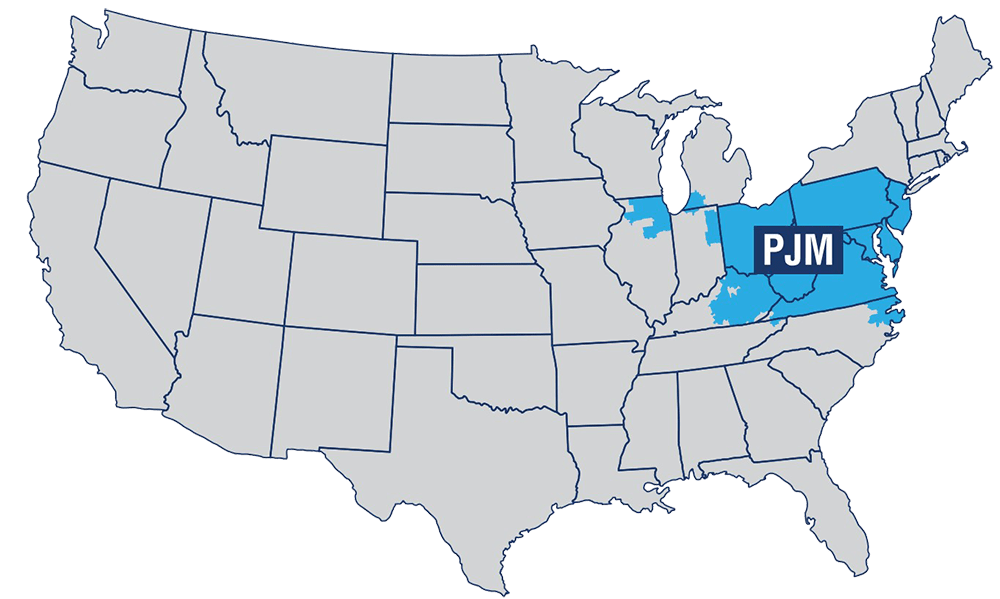
As energy demand peaks in PJM, businesses face higher capacity costs and the risk of grid instability. At the same time, the grid struggles to meet the increased demand, which can lead to power outages and reliance on costly, carbon intensive energy sources. In 2024 capacity charges have increased 450% on average since just last year, meaning higher earnings potential for your business.
Unlocking Benefits of Demand Response in the PJM Market
Generate New Revenue
Earn between $98,000 - $170,000 per MW-Year by participating in Demand Response and reducing energy usage during peak demand times.
Improve Grid Stability
Reducing energy use during peak demand prevents grid overloads and outages. Participation supports grid stability, ensuring a more reliable energy system.
Reduce Energy Spend
Reduce energy costs by participating in Demand Response and curtailing energy use during peak demand times.
Emergency Load Response Program (ELRP)
Program Timing:
Lead Time:
Earning Potential:
The Rodan Energy Advantage: Leading Demand Response Solutions
RODAN ENERGY ADVANTAGE
No Out-of-Pocket Expenses
Customized Energy Plans
24/7 Network Operations Center
Industry Leading Software
Real-Time Monitoring
Customer Support
No Out-of-Pocket Expenses
24/7 Network Operations Center
Real-Time Monitoring
Customized Energy Plans
Industry Leading Software
Customer Support
"Partnering with Rodan Energy has been fantastic. Their strategic guidance has significantly increased our Demand Response revenue. They are highly responsive to our needs and provide exceptional customer service, making them a pleasure to work with."
Mitch Nemier. – Smelter & Energy Manager - Aluminium Manufacturing Plant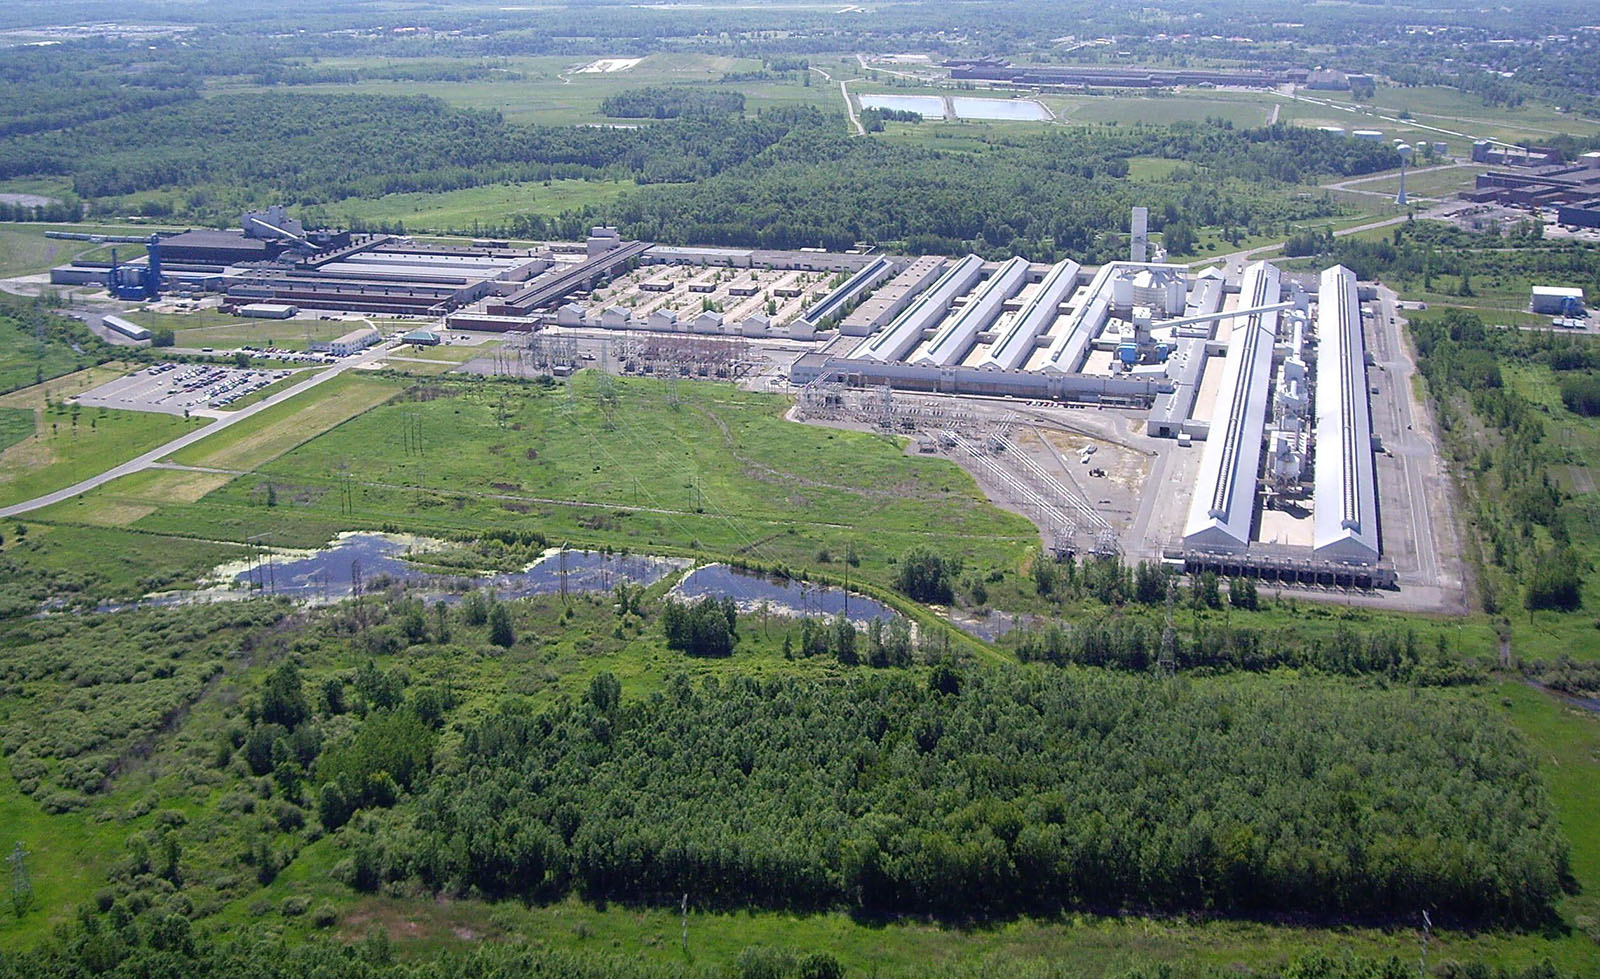
How PJM Demand Response Works

Program Registration
At Rodan Energy we work with you to assess your facility and electrical usage to verify your eligibility. Our team will collaborate with you to define your reduction target and create a custom energy reduction plan to ensure your successful participation.

Event Participation
Once enrolled, you’ll receive notifications about upcoming demand events Using your custom energy reduction plan as a guide, you reduce your energy usage to your target level when notified of an event via your preferred notification method(s). This can even be done through simple adjustments in operations.

Earn Revenue
Receive regular payments based on your performance during events. This translates into cost savings and revenue generation for your business
Start Earning Today
Help Stabilize the Grid! Don’t miss the chance to reduce your energy costs, generate new revenue streams, and play a crucial role in supporting grid reliability.